
How to create graphs or charts using Liferay CMS


Introduction


Sometime back I have to develop solution for charts or graphs to show them in Liferay version 6.1.10 or 6.1.20 and I started looking into different charting solutions that are available in market.There are so many solutions available in the market that will let us to create different kind of charts like Pie, Bar, Column, Line and also the combination charts like bar and spline or stacked charts or combination of any basic graphs. 

Finally based on my requirement and framework(customized version of Liferay) I decided to go with Google Visualization.So let us see how to show the basic graphs using Google Visualization with Liferay Advanced Content Management System. I mainly used Structure, velocity template and Javascript to develop this solution. 

Following are the different graphs that I developed using Google visualization and Liferay CMS.

Technical Details:


The graph or chart that we show can be visualized as point with respect to X and Y axes so based on that I designed my structure as mentioned below 


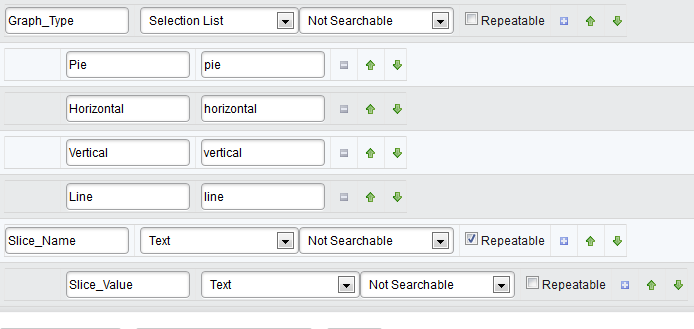
Mainly I designed the structure with the help of 3 elements that are listed below  

1. Graph Type - Selection List to choose which graph to draw
2. Slice Name - Text Field is a repeatable section
3. Slice Value - Text Field which is a child to Slice Name.

Slice Name and Slice value represents one point in a graph since its repeatable you can create as many points as you want to show in graph.

That's it use the below mentioned template by mapping it to the structure for rendering the graphs in web content display portlet.

 
#set($trimmed-title = $reserved-article-title.data.replaceAll(" ", ""))
#set($trimmed-title = $trimmed-title.replaceAll("-", ""))
#set($trimmed-title = $trimmed-title.replaceAll("'", ""))
<script type="text/javascript">
document.write('<scr'+'ipt type="text/javascript" src="https://www.google.com/jsapi"><\/scr'+'ipt>');
document.write('<scr'+'ipt type="text/javascript" > google.load("visualization", "1.0", {"packages":["corechart"]});<\/scr'+'ipt>');
var sliceData${trimmed-title} = '';
</script>
#foreach($slice in $Slice_Name.getSiblings())
<script type="text/javascript">
var sliceName = '['+ "'$slice.getData()'";
var sliceValue = '$slice.Slice_Value.getData()'+'],';
sliceData${trimmed-title} = sliceData${trimmed-title} + sliceName +',' +sliceValue ;
</script>
#end
<script type="text/javascript">
sliceData${trimmed-title} = sliceData${trimmed-title}.replace(/,([^,]*)$/,'$1');
sliceData${trimmed-title} = "["+sliceData${trimmed-title}+"]";
</script>
<script type="text/javascript">
#if($Graph_Type.getData()== 'pie')
var pieChartData${trimmed-title} = sliceData${trimmed-title};
// Set a callback to run when the Google Visualization API is loaded.
google.setOnLoadCallback(drawChart${trimmed-title});
// Callback that creates and populates a data table,
// instantiates the pie chart, passes in the data and
// draws it.
function drawChart${trimmed-title}() {
// Create the data table.
var data${trimmed-title} = new google.visualization.DataTable();
data${trimmed-title}.addColumn('string', '');
data${trimmed-title}.addColumn('number', '')
data${trimmed-title}.addRows(eval(pieChartData${trimmed-title}));
// Set chart options
var options${trimmed-title}= {'width':550,
'height':400,
is3D: true
};
// Instantiate and draw our chart, passing in some options.
var chart= new google.visualization.PieChart(document.getElementById('$trimmed-title'));
chart.draw(data${trimmed-title}, options${trimmed-title});
}
#elseif($Graph_Type.getData()=='vertical')
var verChartData${trimmed-title} = sliceData${trimmed-title};
// Set a callback to run when the Google Visualization API is loaded.
google.setOnLoadCallback(drawChart${trimmed-title});
// Callback that creates and populates a data table,
// instantiates the pie chart, passes in the data and
// draws it.
function drawChart${trimmed-title}() {
// Create the data table.
var data${trimmed-title} = new google.visualization.DataTable();
data${trimmed-title}.addColumn('string', '');
data${trimmed-title}.addColumn('number', '');
data${trimmed-title}.addRows(eval(verChartData${trimmed-title}));
// Set chart options
var options${trimmed-title} = {'width':550,
'height':400, is3D: true};
// Instantiate and draw our chart, passing in some options.
var chart${trimmed-title} = new google.visualization.ColumnChart(document.getElementById('$trimmed-title'));
chart${trimmed-title}.draw(data${trimmed-title}, options${trimmed-title});
}
#elseif($Graph_Type.getData()=='horizontal')
var barChartData${trimmed-title} = sliceData${trimmed-title};
// Set a callback to run when the Google Visualization API is loaded.
google.setOnLoadCallback(drawChart${trimmed-title});
// Callback that creates and populates a data table,
// instantiates the pie chart, passes in the data and
// draws it.
function drawChart${trimmed-title}() {
// Create the data table.
var data${trimmed-title} = new google.visualization.DataTable();
data${trimmed-title}.addColumn('string', '');
data${trimmed-title}.addColumn('number', '')
data${trimmed-title}.addRows(eval(barChartData${trimmed-title}));
// Set chart options
var options${trimmed-title}= {'width':550,
'height':400,
is3D: true
};
// Instantiate and draw our chart, passing in some options.
var chart${trimmed-title} = new google.visualization.BarChart(document.getElementById('$trimmed-title'));
chart${trimmed-title}.draw(data${trimmed-title}, options${trimmed-title});
}
#elseif($Graph_Type.getData()=='line')
var lineChartData${trimmed-title} = sliceData${trimmed-title};
// Set a callback to run when the Google Visualization API is loaded.
google.setOnLoadCallback(drawChart${trimmed-title});
// Callback that creates and populates a data table,
// instantiates the pie chart, passes in the data and
// draws it.
function drawChart${trimmed-title}() {
// Create the data table.
var data${trimmed-title} = new google.visualization.DataTable();
data${trimmed-title}.addColumn('string', '');
data${trimmed-title}.addColumn('number', '');
data${trimmed-title}.addRows(eval(lineChartData${trimmed-title}));
// Set chart options
var options${trimmed-title} = {'width':550,
'height':400,
is3D: true
};
// Instantiate and draw our chart, passing in some options.
var chart${trimmed-title} = new google.visualization.LineChart(document.getElementById('$trimmed-title'));
chart${trimmed-title}.draw(data${trimmed-title}, options${trimmed-title});
}
#end
</script>
<!--Div that will hold the chart-->
<center> <div id='$trimmed-title'></div></center>
My requirement and customized version of Liferay demanded me to develop this kind of solution. Its also possible to develop the solution as a custom portlet using JSON, AJAX with JSR-286 specification.

Also I recommend if you are looking for more complex charts you can customize the template code which I provided or better to take a look into highcharts which is more flexible to write the velocity template in generating the complex charts.

Hope it helps :)

Comments